Build Notification Banners With ElmaStudio’s Latest Block Plugin
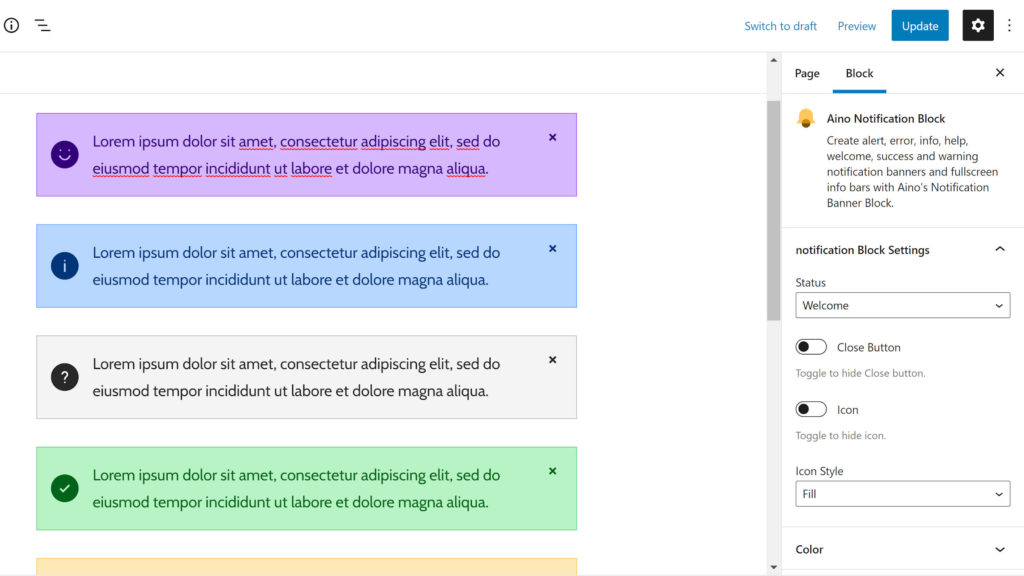
A friend and I were discussing the need for more one-off block plugins earlier today. He had mentioned that WordPress has this powerful block search feature that rarely turns up anything useful. Most are part of collections that do not appear in the results. This was part of a more wide-ranging conversation that I am sure I will tackle on another day. However, it reminded me that I had a couple of ElmaStudio’s block plugins sitting in the backlog along with some notes on them. The team released Aino Accordion FAQ Block and Aino Notification Banner Block three weeks ago. The latter piqued my interest more so than the former. Inserting an error notification. The two-person team of Ellen Bauer and Manuel Esposito could have continued amassing a collection within their existing Aino Blocks plugin. Instead, they took a turn down the path few have traveled. They are now releasing single-purpose blocks. “We plan to work on smaller add-on single blocks from now on as well,” said Bauer in the comments on my last review of their theme and block library. “Blocks that are needed for building more complex block page templates.” Notification boxes are so commonplace that you almost…
…Full post on WP Tavern
Read Full