
10up Releases the Publisher Media Kit WordPress Plugin
…Full post on WP Tavern
Read Full

…Full post on WP Tavern
Read Full
The third release candidate (RC3) for WordPress 6.5 is ready! This version of the WordPress software is under development. Please do not install, run, or test this version of WordPress on production or mission-critical websites. Instead, it’s recommended that you evaluate RC3 on a test server and site. While release candidates are considered ready for…

On Saturday, one side of my family held our pre-Thanksgiving reunion. It had been two years since we were able to do it. I offered to host this year when our previous venue’s loss threatened to sideline the event for yet another year. Needless to say, I was exhausted by the time my last cousin…

As more WordPress plugins for AI-generated content and images, chatbots, and assistants, are landing in the official directory, developers are beginning to explore even deeper integration with the block editor. Moving beyond the prototypical content generators that are cobbled together into a plugin, the tools developers are experimenting with today will provide a more deeply…
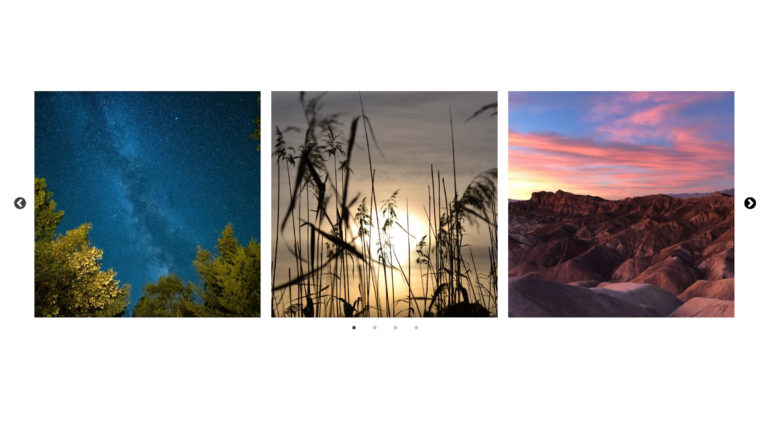
Over the weekend, Virgiliu Diaconu asked me to check out his Carousel Slider Block plugin, a project he has maintained for three years. It has slowly garnered more than 5,000 active installs since its release. I get emails like this every day. More often than not, the projects are fundamentally broken or are a bit…

A couple of weeks ago, Rich Tabor announced a GitHub repository that listed all of his block plugins. These were already publicly available. However, some had yet to land in the WordPress plugin directory. As a fan of his simple approach to block design, I was quick to start tinkering with them. One of those…
WordPress 6.5 Beta 3 is here and ready for testing! This beta version of the WordPress software is under development. Please do not install, run, or test this version of WordPress on production or mission-critical websites. Instead, it is recommended you evaluate Beta 3 on a test server and site. You can test WordPress 6.5…