Tell a Story With Your Data: 7 Data Visualization Plugins for WordPress
…Full post on Torque Mag
Read Full

…Full post on Torque Mag
Read Full

Oh my god, it’s already November! About high time to look at the web design trends for 2024. In this recurring series (see 2020, 2021, 2022, and 2023), we’re looking at the aesthetics and technologies we think will dominate web design in the coming year. For website owners, theme and web designers, developers, and other…

After 10 years in the WordPress ecosystem as one of the most popular plugin businesses, Yoast is branching out with a new SEO app for the Shopify market. The app will offer Shopify merchants a set of optimizations for search results and Google Shopping, automatically add structured data, and allows users to optimize for desired…

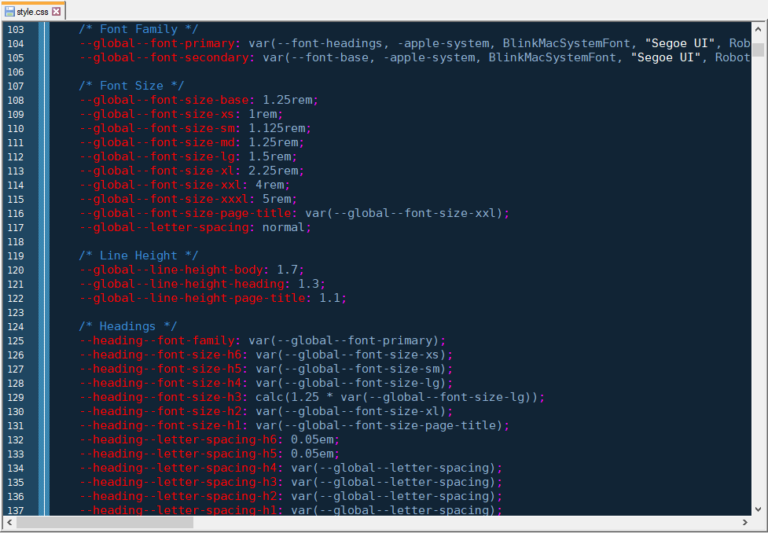
In this post, we will talk about CSS custom properties, also known as CSS variables. Their usage is becoming more popular. For example, if you open up the style sheet of the Twenty Twenty-One default theme, you will find a lot of them in there. One of the reasons is that their browser support has…

The Torque Social Hour is a weekly livestream about WordPress news and events. This week we are joined by Anthony Burchell to talk about his newest project, 3OV, a 3D WordPress plugin which turns your site into a VR/AR experience . Watch the episode here. Remember to vote for your favorite plugins on https://pluginmadness.com Torque…

Another two weeks have flown by, and another Gutenberg plugin update is in the books. I always look forward to the latest release, awaiting what goodies our contributor community has produced. Sometimes I jump the gun and install a development version of the plugin to understand an upcoming feature, such as the new “block gap”…

Ari Stathopoulos announced a proposal for implementing a web fonts API in core WordPress. The goal is to standardize how theme authors register and enqueue font styles. It may also serve as the foundation of other features down the road. Jono Alderson opened the original ticket for such an API in February 2019. The discussion…